When I started school this fall, and ran for the 2018 class president for Muskingum University, I was quite surprised by how they ran their elections. Each candidate gets ten dollars to spend on their election. That's it. Now these funds could be spend for various different things, but that was all that was provided. I was told it was limited to keep things fair. It got me and a few of my fellow class mates talking about the funding of elections and how our families had never donated to a campaign. Simply put many middle class families don't give money to elections. But the Supreme Court recently stated that money is free speech, so I assume that some just have more free speech than others.
We joked and then one of my friends asked me, "Jason do you think that local and state elections have the same results?" It was at that moment that the light bulb went off in my head. I guess I should back track for a second and say how I've always loved politics and my dream is to be a politician, but that question peaked my curiosity.
Some day I want to run for the Ohio House of Representatives and the question that started me on this journey was simple, does the candidate with the most money in The Ohio's House of Representatives elections always win? For my research I used a site called FollowTheMoney.com. This is a great site for finding election funding information. I painstakingly went through all 99 Ohio House Elections and what I found was disappointing.
Of the 99 elections in 2012 for The Ohio House of Representatives,
87 out of the 99 won having spent more money.
87.9% of Candidates won because they had more MONEY
(87/99=87.9%)
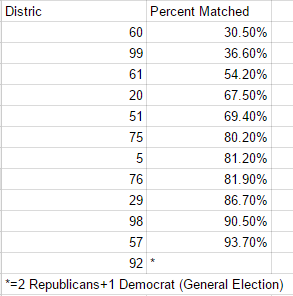
The below chart is a list of those who won,
but had spent less money

Now lets put those in order
So if we take the eight below elections...
If the candidate can match 67.5% of the funding then they still have a chance of winning
(87+8=95/99=96%)
So 96% of the time a candidate HAS to spend at least
67.50% of what their opponent spent for a CHANCE to win

But wait there's more...

If we look at district 61...
(above)
if the candidate can match at least 54.20% of the funding they
still have a slight chance of winning
(95+1=96/99=97%)
So 97% of the time a candidate HAS to spend at least
54.20% of what their opponent spent for a CHANCE to win

Now lets look at the two remaining elections...
In district 60 and district 99...
if the candidate can match at least 30.5% of the funding they
still have a very slight chance of winning
(96+2=98/99=99%)
So 99% of the time a candidate HAS to spend at least
30.50% of what their opponent spent for a SLIGHT CHANCE to win
Now I know what you're thinking, I forgot district 92
well not exactly..
See district 92 is a rare one...
Two Republicans and One Democrat ran in the General Election

But here's the problem, Bob Peterson dropped out of the General Election

Now the only thing I can say is between the
2010 and 2012 elections, the State of Ohio had to redistrict
But I think the above graph speaks for itself
...but if you need a hint look at how much he spent in his 2010 election...
Hello, my name is Jason Schaumleffel. I am a Political Science, Economics, and Communication major at Muskingum University. I also happen to be class president. If you found this interesting, please share as I spent many hours of research to bring this information forward.
No comments:
Post a Comment